Controlling change and enforcing internal or external policies requires not only trusted change and compliance data, but the ability to quickly transform that data into relevant, meaningful information. Tripwire® Enterprise is known for its unparalleled ability to assess and validate configuration settings and manage configuration changes, but it’s also the most dependable source available for the business critical change and compliance information modern IT organizations depend on.
Tripwire Enterprise’s comprehensive portfolio of customizable ready to use reports and dashboards cover all your information needs. There’s even easy report linking, which allows users to “drill down” to view the most granular detail about system changes and compliance. By being able to generate timely and critical information about enterprise infrastructures, these reports are leveraged daily by auditors, IT management, and operations teams. Tripwire Enterprise provides nearly 40 reports, with additional in development. This Report Catalog provides detailed information and screenshots of each report and dashboard. As new reports are continuously being developed, please refer to the Tripwire website for information on newly added reports. You can view sample reports here.
Change Auditing:
Report Drilldowns and Linking
Tripwire Enterprise reports have a built in linking function, providing drill down capability so users can dig into change information and discover the details of a change, when and where it was made, and even the ID of the user who made it. In this example, a change manager used Tripwire Enterprise reports to review the ratio of approved to unapproved changes and validate the overall efficacy of the change process. He started at his dashboard (1) and quickly generated a Change Process Compliance report (2), which showed all changes made to the selected machines in the given time period, as well as the proportion of approved to unapproved changes
Drilldowns and Linking
Next, by selecting a specific node and a linking option, the user invoked a “Changed Elements – Who” report, and obtained specific information on the ID of the user making the detected changes. In this case, it looks like the changes were made by a junior admin. But what was their extent? What’s the potential risk?
At this point the change manager decided to follow the trail and review all changes made by this user in detail by running a “Detailed Changes” report to drill down into the node, revealing every changed element, as well as the affected rule.
Lastly, the change manager decided to reconcile and remediate the changes directly from the Tripwire Enterprise console. To facilitate this, some reports have “action” toggles that allow the user to switch directly from the report to console operator’s view of the same infrastructure. When the action toggle is engaged the view switches to a node view of the impacted servers and devices, where the user can reconcile, promote, or run other actions against the detected changes.
Compliance Policy Management:
Report Drilldowns and Linking
Users who rely on Tripwire Enterprise to assess the state of their systems against standards and policies can also benefit from the linked, drillable report structure. In this example, an energy company compliance officer starts from a standard dashboard to obtain an understanding of how compliant his systems are against NERC (North American Energy Reliability Corporation) cybersecurity standards for his organization’s different platforms. He notes that his SUSE Linux nodes have experienced 15 failed tests, and clicks on that image to generate a “Test Results Summary” report. This report sums up the overall passing/failing scores for his SUSE Linux servers and shows and an overall policy score as a percentage. But what about specific details on the tests that failed? And how can the compliance officer provide his operations team with a “punch list” of instructions for how to get these systems back into alignment?
Remediation Instructions
By next clicking on the machine identifier under the “node” column, the compliance officer can generate a “Detailed Test Results” report. This report spells out the governing requirement for the control if applicable as well as the current condition of the element being tested.
Embedded in this report is a set of complete remediation steps. To begin getting these systems back into alignment with the NERC standards, the compliance manager can forward these instructions to the operational owner of the server or device, dramatically simplifying and acce the entire remediation process.
Report Customization
The criteria defining each Tripwire Enterprise report are entirely customizable, allowing users to specify exactly what information is revealed in each report. The depth of detail can be increased or decreased, as well as the overall scope and coverage of each report, from the included nodes and devices to the specific tests and rules. Of course all customized reports can be saved and rerun whenever needed. Reports are available in HTML, XML and PDF formats, and can be scheduled to be generated and automatically emailed to appropriate personnel.
Tripwire Enterprise Reports
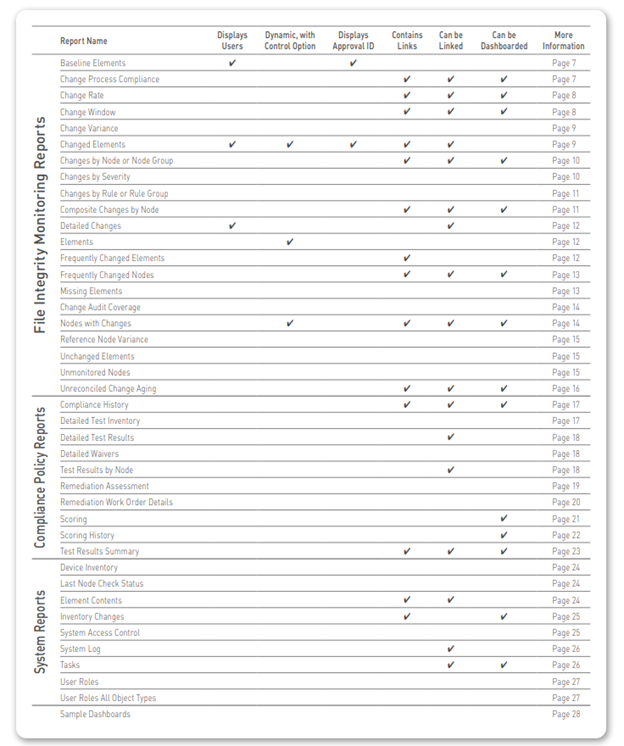
File Integrity Monitoring Reports
Baseline Elements
The Baseline Elements report lists details about baseline elements for specified nodes. By reporting all changes promoted to the current baseline, including who made the change, approval IDs, and comments that indicate why the change was approved, this report satisfies the audit requirement of showing that changes are authorized.
Change Process Compliance
This report identifies authorized and unauthorized changes to specified nodes over a period of time. An authorized change is associated with a valid change request ticket ID. This management report displays trends in the effectiveness of—and adherence to—change process controls, and is usually run at least weekly.
Change Rate
This report shows the total number of changes (additions, removals, and modifications) detected on specified nodes over a period of time. Within the selected time period, the report displays the number of changes at a regular interval (or “frequency”); for instance, daily, weekly, or monthly. This high level report is used to reveal abnormalities in the change process, and is run monthly or more often, depending on process maturity.
Change Window
This report indicates the number of detected changes for a specified monitored system(s) that have occurred inside and outside a defined change window. Changes outside the change window can potentially affect service quality through downtime or restricted system access. Numerous changes outside change windows are an indicator of process circumvention, a frequent cause of poor system quality. This report is normally run before and after each change window.
Change Variance
This report shows the elements that differ between specified monitored systems. As appropriate, you can limit report output to specific nodes, rules, and/or elements. This report is frequently used to compare changes on nodes after a patch/install has been implemented, so that changes that are inconsistent across the nodes can be flagged and reported. It is typically run ad hoc, though potentially weekly or monthly
Changed Elements
This report identifies elements that have been added, modified, and/or removed. For each element, the report can also identify a variety of associated data, such as approval IDs or specific attributes that changed. It is generally run as needed, to help Operations identify what changed when a service affecting problem occurs, thus reducing Mean Time To Repair (MTTR).
Changes by Node or Group
This report displays the number of changes detected on one or more monitored systems. The change comparison calculates the total number of changes for each system, as well as the totals for each type of change (added, removed, or modified). This is a management report providing an overview of the types and locations of changes, and is typically run weekly.
Changes by Severity
This report shows the total number of changes detected on selected monitored systems that fall within a specified range of severity levels, helping operations staff identify changes that have the potential to adversely impact service quality. It is normally run daily.
Changes by Rule or Group
This report calculates the number of change versions for monitored objects identified by each specified rule or rule group. For each rule or group, the report also calculates the total number of change versions for each type of change, e.g. added, removed, or modified changes. Often used as a means of identifying network resources that experience an abnormally high rate of change.
Composite Changes by Node
This report is typically used to enforce change management policies by tabulating the number and authorization of composite changes. A composite change consists of one or more element versions created for a single node in a single time interval specified by the report (such as a day or week). This report calculates the number of authorized and unauthorized composite changes for each specified node and/or node group within a specified period of time.
Detailed Changes
This report compiles comprehensive change information for monitored objects associated with specified monitored systems. It is typically run ad hoc to help Operations identify what changed when there is a service affecting problem, in order to reduce MTTR. It can also be used to automatically reconcile authorized changes and to generate alerts for unauthorized changes.
Elements
This report lists all elements identified by the specified criteria. Optionally, the report can also identify the package associated with each element. By identifying the elements, Operations can ensure that the proper systems, files, settings, configurations, etc. are monitored. It is typically run on a monthly basis.
Frequently Changed Elements
This report ranks the most frequently changed elements that meet the specified criteria. For each element, the report identifies the total number of changes, the time of the most recent change, and the element’s node. This management report identifies elements that change on a regular basis as part of normal business processes, the data then being used to tune monitoring rules for more efficient integrity checks. In general usage, it is run weekly until rules are tuned, then monthly.
Frequently Changed Nodes
This report ranks the most frequently changed monitored systems that meet the specified criteria. The report includes the total number of detected changes for each system, as well as the totals for each type of change (added, removed, or modified). This management report is used to identify nodes that could potentially cause problems due to frequent changes, and is typically generated weekly
Missing Elements
This report identifies nodes that lack elements with specific names, or elements created by a specific rule or rule group, allowing users to pick either rules or element names and determine whether or not they are missing on a target set of nodes. This report helps Tripwire Enterprise administrators configure the application to detect configuration drift, and is generally run weekly or monthly
Change Audit Coverage
This report identifies the components associated with each file system, database and directory rule in a Tripwire Enterprise implementation, to determine if the appropriate rules are applied to the correct systems and devices. It is typically run monthly, or whenever new rules are created to ensure that they are correctly defined
Nodes with Changes
Details table sort: Name, ascending For the specified criteria, this report identifies the number of monitored systems that have changed over a given period of time, providing a synopsis of changed vs. unchanged systems or devices. It is generally run weekly or monthly.
Reference Node Variance
This report identifies all elements that differ between one node (the reference node) and another (the compare node). In a single report the reference node may be compared with one or more compare nodes, readily identifying configuration drift, which can lead to system instability and failure. It is typically run weekly or monthly, as well as following each patch installation.
Unchanged Elements
For one or more nodes, this report identifies all elements for which Tripwire Enterprise did not detect a change in the specified time range. Alternatively, the report can identify the rules used to baseline any unchanged elements. It is used to detect elements that were expected to change over a period of time, but did not. This management report is typically run monthly, or as needed.
Unmonitored Nodes
This administrative report is used to ensure that the proper nodes are being monitored in your Tripwire Enterprise implementation. It identifies: 1) Nodes that lack a valid Tripwire Enterprise license; 2) Nodes that have not been baselined or version checked within a specified period of time and 3) Monitored virtual machines on which a Tripwire Enterprise agent has not been installed and enabled.
Unreconciled Change Aging
When an organization strives to adhere to proactive change management practices it’s important to know which changes have remained unreconciled the longest, and why. The Unreconciled Change Aging report provides this information graphically, immediately and accurately, detailing the infrastructure changes that have gone the longest without being addressed, and helping prioritize reconciliation efforts.
Compliance Policy Management Reports
Compliance History
This report calculates the number of passing and failing policy test results created for all specified nodes for each specified time interval. It is typically used as a management report showing the historic trend of compliance with a policy.
Detailed Test Inventory
For each specified test, this report provides a test definition that includes details such as test description, type, severity and weighting. This report makes it easy for management to generate and share formal test documentation, as well as view this information offline. Most often used as a reference list that documents the properties of specified policy tests.
Detailed Test Results
This report lists all policy results for each specified node that meet the specified report criteria. For each result, the output indicates which element was tested, and the outcome (passed/failed). This report is a means of identifying specific settings that are out of compliance with a policy and that may require modification.
Detailed Waivers
This report provides a detailed list documenting the properties of all specified waivers. For each specified node and test, it provides a complete listing of the waivers and related details such as start and end dates, reason for the waiver, and who is responsible for remediation. Security and IT operations can use this report to better manage waivers and remediation with less effort.
Test Results by Node
This report provides a reference list showing failed policy test results that indicate monitored systems requiring remediation. It presents data about policy test results for all nodes specified by the report criteria. The output of the report contains:
- A summary list of nodes, which includes the total number of policy test results that each node passed and failed;
- A detailed list of nodes, which includes a sub list of policy tests run on each node. (For each policy test, this list may also indicate the test’s rule(s) and version attribute conditions);
- A list of nodes that experienced errors when a policy test was run.
Remediation Assessment
Use this report when you need to know not only which remediations have been performed, but also understand post remediation actions and dispositions across all work orders. It also shows the total number of nodes remediation was applied to, as well as the number of successful remediations across all work orders. Because this report provides details on a number of remediation runs over a given time period, it provides excellent success metrics for determining Remediation Manager’s overall ROI.
Remediation Work Order Details
This report provides detailed information about remediation work orders and remediation entries, including how many policy test repairs were Approved, Remediated, Deferred or Denied in the specific work order. This gives an instant overview into the overall effectiveness of a given Remediation Work Order, as well as cost savings, descriptions of the scripts being executed, times they were run, and any alerts or errors that might have occurred.
Scoring
For each specified policy test or policy test group, this report indicates the number and percentage of nodes that are in full compliance with the test (or group), and the number of nodes that are not in full compliance. This is used as a high level management report providing a comprehensive view of compliance throughout your organization.
Scoring History
This is a management report that indicates past trends in the policy scores of monitored nodes For all policy scores that satisfy the report’s criteria, this report presents the following data for each period in the specified time range:
- The highest and lowest policy scores for the period (green and red lines) and
- The average policy score for the period (blue line).
Test Results Summary
This high level management report provides a comprehensive view of compliance throughout your organization. For each specified Policy Manager object, this report indicates:
- The number of specified nodes that are not in full compliance with the Policy Manager object;
- The number and percentage of specified nodes that are in full compliance with the object. Note: In some previous versions of Tripwire Enterprise, this report was known as a ‘Policy Scorecard Report.’
System Reports
Device Inventory This report provides a reference list of monitored systems. It identifies the make, model, and version of specified monitored systems. This management report showing devices being monitored helps insure that the correct systems and nodes are being controlled. It is generally run monthly, potentially more frequently depending on process maturity.
Last Node Check Status
For a specified time range, this report identifies the date and time of the last version check run on one or more monitored systems. As appropriate, report output can include:
- The names of all nodes for which the last version check ran successfully;
- The names of all nodes for which the last version check failed; and
- The names of all nodes for which a version check was not run.
This management report ensures that nodes are being checked as scheduled without any failures occurring. It is typically run monthly, or more frequently as needed.
Element Contents
The Element Contents report displays the full contents of all Tripwire Enterprise elements—even if the content didn’t change from the last baseline. This report is especially useful in conjunction with Command Output Capture Rules (COCR), which gather and output key information about nodes, (e.g. BIOS and OS versions, memory capacities, etc.)
Inventory Changes
This report calculates the number of nodes monitored by the Tripwire Enterprise implementation that have been added, modified, and deleted over a specified period of time. This management report keeps track of systems and nodes on the network, and is normally run at least monthly.
System Access Control
This report provides security related information on specified user accounts, user roles, user groups, and/or access controls. This management/administrator report is used to ensure that correct roles with appropriate access levels are defined, and that the correct users have the correct roles. It is normally run monthly.
System Log
This report identifies Tripwire Enterprise log messages that match specified criteria. This management report is similar to Tripwire Enterprise’s log searching capability, but with results in generated report formats. It is normally run on an ad hoc basis.
Tasks
This report details the state and condition of each of Tripwire Enterprise’s scheduled tasks: when tasks were last completed, whether any tasks have stalled or timed out, the parameters for all currently scheduled tasks, etc. This provides quick insight into the workings of the Tripwire Enterprise system.
User Roles
For a specified node or node group, this report identifies the effective user role for a selected user account. The effective user role is the actual level of control that the user has over the specified node or node group. This management report shows who has access to what in the Tripwire Enterprise Server, and is typically run monthly, potentially more often depending on process maturity.
User Roles All Object Types
This report is means of ensuring that proper levels of control have been assigned to existing user accounts. For one or more Tripwire Enterprise objects, it identifies the effective user role for each specified user account.
Sample Dashboards
Tripwire Enterprise’s customizable dashboards provide at a glance confirmation of your infrastructure’s change and compliance status. When integrated with user homepages, these dashboards allow each user of the system to have a customized display that provides high level compliance information, fine grained views of systems or elements, or any level in between.